Dynamic display of the timing chart :
A double Click is used for :
to choose the signals to be visualized ;
to make the various adjustments.
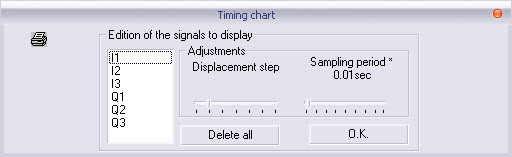
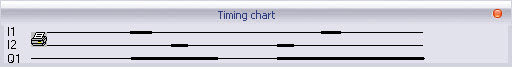
After validation, you visualize the evolution of the signals.
The display of the analog values
In Stop mode, choose the signals to be represented then mask the principal window.
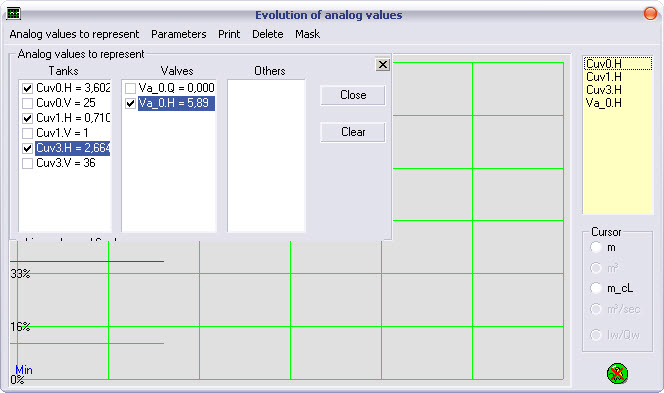
In Run mode, we gets :
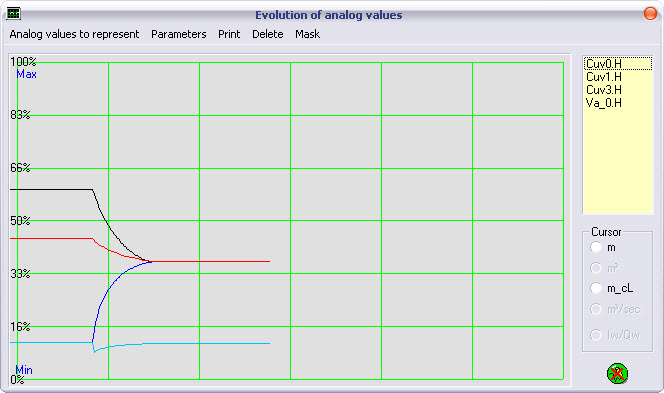
![]() This
button allows to make a pause of the layout.
This
button allows to make a pause of the layout.
Dynamic display of the programmable automaton S7 is used to control the correct operation of inputs and outputs.
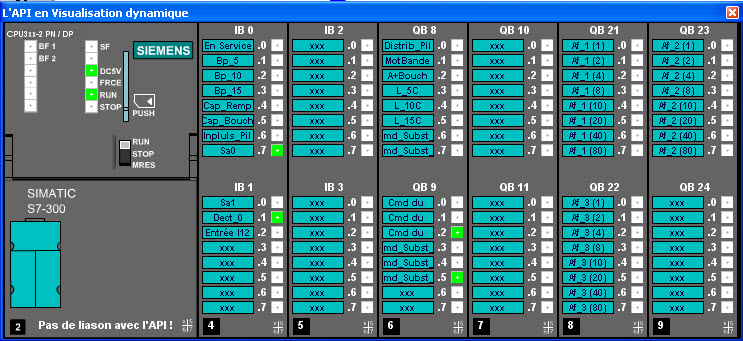
The loss of connection with the automaton is also indicated !